“I choose a lazy person to do a hard job. Because a lazy person will find an easy way to do it.” ― Jason O'Neill Bill Gates
My manager has always encouraged me to be lazy in my job. So much so that I wanted to attribute the above quote to him. This pursuit of being lazy is what inspired me to develop this project using Machine Learning. The result: it cut my reporting workload in half, and the report has helped our executives better organize the company’s efforts. Our long term goal is to improve the company’s efficiency to better serve our customers with quality products and services.
Augmenting my time
Making use of Machine Learning to augment people’s work is a running theme here at ThoughtWire. The theme is evident in our product philosophy of enabling people through our technology - whether they are nurses using our Smart Hospital products to cut down on reporting times or property managers using our Smart Building products to improve energy management.
With this philosophy in mind, my manager and I decided that we could attempt to use machine learning to augment my reporting task by predicting the management categories from the data already captured in JIRA. To give more context, this report was meant to give management a visual understanding of where our Engineering team was spending their efforts. It helps management ensure that engineering efforts are being focused on projects that aligned with ThoughtWire’s strategic priorities.
I was generating this report (or graph) every two weeks, and each time it took a full day to complete. Most of this time was spent on mapping JIRA stories to the categories that management expected.
The Outcome: Management Roll-Up now takes 50% less time
The project now uses a machine learning algorithm to classify JIRA stories - actually stories, tasks, and bugs - into categories. At the end of the project, we were able to achieve a 50% reduction in the amount of my time required to generate this report.
As you can see in the side by side comparisons below, the manually mapped version looks almost identical to the machine version!
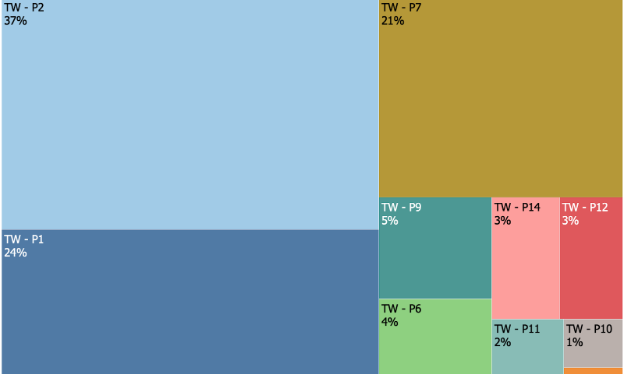
Engineering effort distribution by Product - Manually mapped
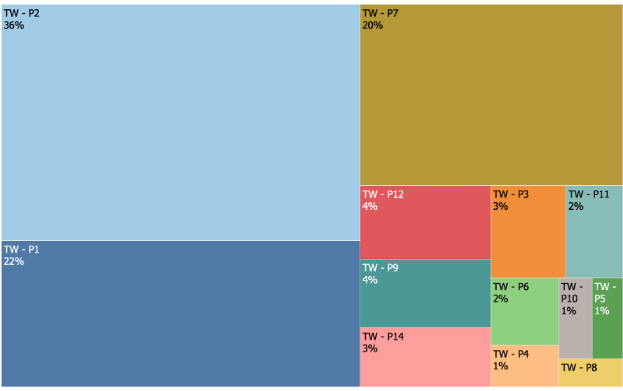
Engineering effort distribution by Product - Machine mapped
How we did it:
1. Picking a Measure to Achieve: Something Good Enough for Decision Making
As with any machine learning classification approach, we needed to pick a metric in order to know when our classification was good enough for us to stop refining our algorithm. After discussing with the stakeholders, we concluded that 85% accuracy is good enough for executive level decision making purposes.
2. Picking a High-Level Approach: Bag of Words
Since we had a lot of context of what the stories were about in JIRA’s text fields, we postulated that a Bag of Words approach might be a good place to start. We wanted to use this approach to predict the subcategory of the new stories. Once identified and categorized, it calculated the relative effort that the ThoughtWire Engineering team put into each category by using story points as weights.
3. Data Preparation: Some Manual Work the First Time
After exporting all the stories from JIRA, the data was preprocessed. This included identifying and defining the list of sprints that were of interest, and filtering out unwanted issue types like Epics. Additionally, to manage stories that were included in multiple sprints, there was an issue with multiple mappings created between stories and sprints. This arises when a story was worked on in two sprints, which means it will have two entries - one mapped to each sprint. 1200 stories were manually labeled and mapped to one of the 46 sub-categories - not fun if you were wondering.
4. Feature Engineering and Model selection: Leveraging good posts!
Thanks to this excellent post from Towards Data Science, we were able to quickly get started on the “Bag of Words” method. We started off by using the summary field within a story as the sole feature. The texts in the field were transformed using TF-IDF Vectorizer. The TF-IDF Vectorizer take a corpus of text, enumerates different words and ranks the importance of those words. The dataset was split into test and train datasets and performance of the following models were compared.
-
RandomForestClassifier (Tree-based algorithm)
-
MultinomialNB (Multinomial Naive Bayes)
-
SVC (Support Vector Machine Classifier)
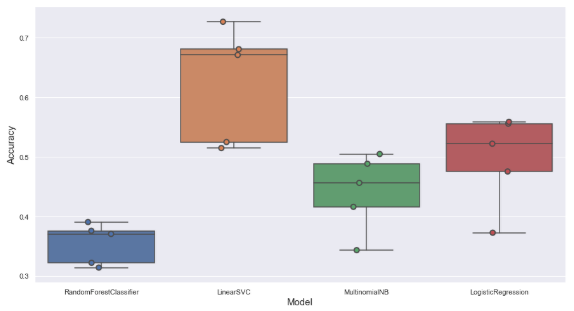
Comparing model performance
4. Prediction and Validation:
Once we zeroed in on Linear SVC as the best model to proceed with, it was used to predict the sub-categories for previous unseen data. Ideally, we could use predict_proba function as a metric of confidence in the individual classifications.
Unfortunately, Linear SVC does not have a default function that we can use. To validate the predictions, we tried to use an alternative method as described here but finally decided to use the decision matrix. We use the distance between the first and second prediction for each story as a proxy for the confidence in the prediction. We plan to set a threshold and manually review the stories with the calculated difference below the threshold. This should make sure that the model keeps on adjusting as we accumulate more data.
Additionally, we plan to review the teamwise spread of work across different products to make sure that the classification passes a qualitative test.
The Future: Improving and Maintaining Accuracy
- Identifying and incorporating additional fields into the features, feature engineering, is probably an obvious next step. Columns like project name and Epic name are great candidates.
- Another concern that we plan to tackle is ensuring that the model does not deteriorate over time with overfitting. This is valid given that teams will be working on different product features over time. The current stopgap solution is a manual review.
- Machine steals my job!
Nailed it!
With the help of Dalia and Ted, I created a reporting mechanism that provided the executive team an overview of the engineering team’s current projects without adding to their workload during story creation in JIRA. We used Python and Jupyter Notebook to develop the project, utilized Scikit-Learn for the machine learning components and Tableau for visualization.
And if you are wondering how I am spending the time saved through the project, please do not!
About the Author: Tony Baby
I am a Data Analyst at ThoughtWire with a focus on product analytics and reporting, but really my job is to evangelize data-driven decision making. Prior to ThoughtWire, I worked at Dun & Bradstreet in the US and Oracle in India. I have an MBA from the University of Texas at Austin and a fondness for the outdoors. I live with my wife and 3 kids in Toronto (if you're pushy I'll admit to living in North York). And I refuse to write about myself in the 3rd person.